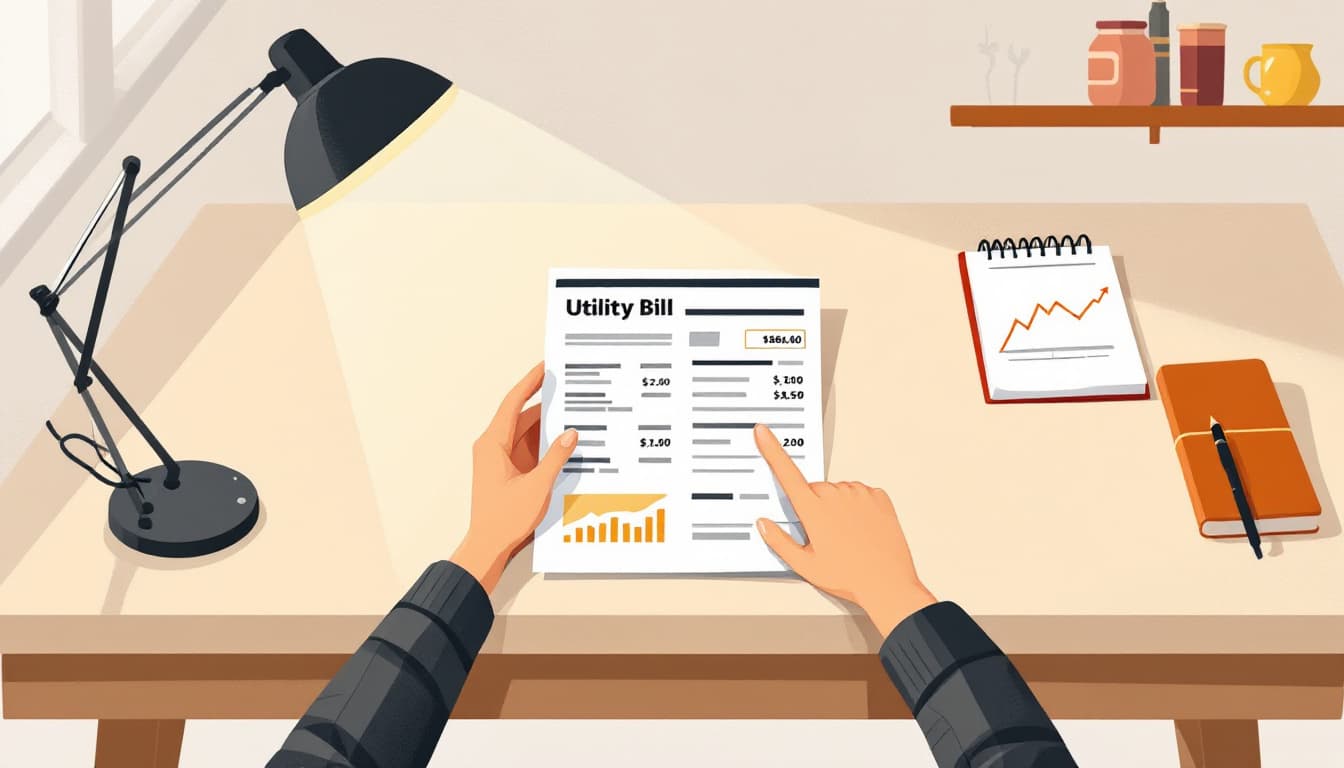
Last October, a neighbor knocked on our door to ask why her electric bill had nearly doubled. She had the bill in hand — the one with the bar chart along the bottom showing twelve months of usage. She had been looking at it for a week. She had not noticed that the chart showed a jump in July that persisted straight through September, while her neighbors' usage had returned to baseline in August. Her heat pump had developed a refrigerant leak. The bill had been telling her that for three months. She just didn't know how to listen.
That story is not about emergency preparedness. It is about literacy — the specific, trainable skill of reading a document that arrives in your home every month and contains more useful information than most people ever extract from it.
It is also, it turns out, exactly the kind of skill that compounds under pressure.
What the bill actually contains
A standard electric or gas utility bill has at least three layers most customers never reach.
The first layer is the dollar amount. Everyone reads this.
The second layer is the usage figure — kilowatt-hours for electricity, therms or CCF for gas. Most people glance at this, maybe notice it's higher than usual, and move on.
The third layer is the rate structure: the difference between your baseline tier, your above-baseline tier, demand charges if you're on a time-of-use plan, and any fixed monthly charges that don't vary with consumption at all. This is where the leverage is. If your baseline allowance is 500 kWh per month and you routinely use 900, you are paying the higher per-unit rate for nearly half your consumption. Shifting a clothes dryer cycle to off-peak hours can move you out of that tier entirely. Recent data from utility regulators suggests most residential customers on time-of-use plans have never checked which tier covers their peak usage hours.
Water bills have a fourth layer many people miss entirely: the break between metered consumption and the sewer charge, which in most municipalities is calculated as a percentage of your water use. If you have a slow toilet flapper leak — the kind that's inaudible and invisible — your sewer charge grows alongside your water charge. Two costs, one leak.
Why this is harder than it looks
Utilities are not legally required to make their rate structures easy to read, and most don't. The tariff schedules that govern your bill are public documents, but they are written for regulators, not households. Finding your actual per-kilowatt rate often requires a separate search for your utility's tariff schedule — a PDF that reads like a zoning ordinance.
This is exactly why most people stop at layer one. The bill looks like an invoice. Invoices are for paying, not studying.
The preparedness industry largely ignores this skill because it photographs badly and doesn't require any gear. You cannot sell someone a better way to read a utility bill. But the families who understand their utility baselines — who know what a normal August looks like versus an abnormal one — are the same families who notice when a chest freezer starts cycling inefficiently, when a water softener is regenerating too frequently, or when a slow leak has been running for six weeks. These are not survival skills. They are maintenance skills with a very low cost of entry and a very high return over time.
Under stress — a job disruption, an extended heat event that spikes cooling bills, a household member suddenly working from home — that baseline knowledge becomes a rapid-diagnostic tool. You already know what normal looks like. Abnormal is obvious.
What to do this week
Set aside ninety minutes. Pull the last twelve months of bills. Your utility almost certainly has an online account portal that stores them; if not, check your email archives.
Build a simple table. Spreadsheet or paper, doesn't matter. Month, usage in the unit the bill uses (kWh, therms, gallons), and dollar amount. Twelve rows. This is your household's baseline profile.
Find your rate schedule. Search "[your utility name] residential rate schedule tariff." Download the current PDF. Look specifically for: your baseline allowance, the above-baseline rate, and whether you are on a flat or time-of-use plan.
Identify your highest-consumption month from the past year and ask why. Air conditioning? Holiday cooking? A houseguest? An equipment problem? In most cases, you'll know immediately. If you don't, that's valuable information too.
Check your water bill separately. Compare your sewer charge as a percentage of your water charge across the last six months. Unusual swings in that ratio, when your habits haven't changed, suggest a leak worth investigating.
The neighbor with the heat pump eventually got it repaired, about $800 in refrigerant and labor. The technician told her it had probably been leaking since late June. Three months of elevated bills, plus the unit working harder in August heat, had shortened the compressor's remaining lifespan.
She now reads her bill to the third layer every month. She texts occasionally when something looks off, wanting a second opinion on whether the number makes sense. That is what utility literacy actually looks like in practice — not a dramatic discovery, just a habit of attention that keeps small problems from becoming expensive ones.
Most useful skills work this way. They are not exciting to acquire. They compound quietly, month after month, and they reveal their value at the moment when you most need to think clearly and fastest.