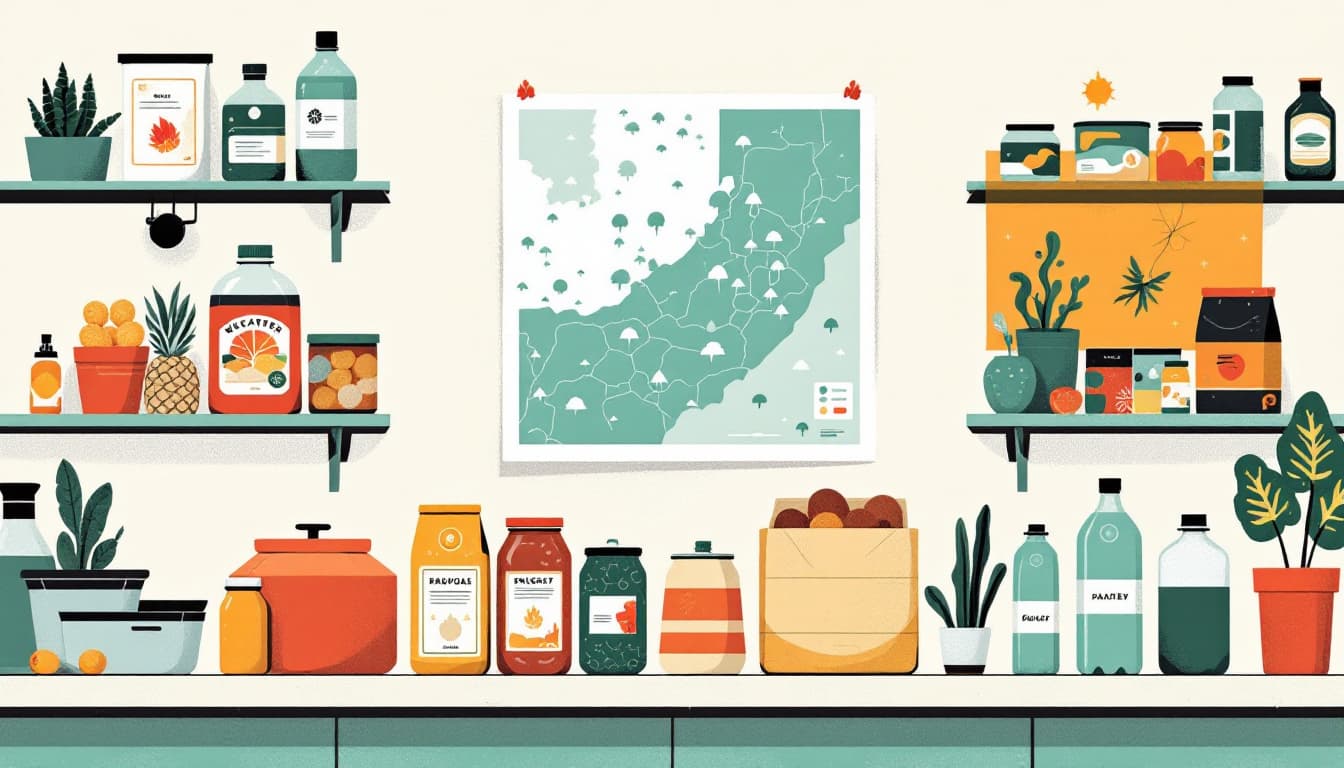
A report this week from The Hill details the geographic footprint of what climate scientists are now characterizing as a potential "super" El Niño developing in 2026, with forecast models showing sharply divergent outcomes depending on region — significant rainfall accumulation in some corridors and severe drought conditions in others.
El Niño events are defined by anomalous warming of sea surface temperatures in the central and eastern tropical Pacific Ocean. A "super" designation is applied when sea surface temperature departures reach or exceed approximately +2°C above the long-term average, a threshold that amplifies downstream weather disruptions well beyond a standard event. The 1997–98 super El Niño, still the benchmark event in the modern record, was associated with economic losses estimated at roughly $35–45 billion globally and contributed to drought conditions affecting an estimated 100 million people across Southeast Asia, Australia, and parts of Africa.
The Hill's coverage maps out the anticipated winners and losers of the 2026 event as modeled by forecasters. Regions expected to receive well-above-normal precipitation include the southern tier of the United States — particularly the Gulf Coast states, the Southwest, and parts of the Southeast — as well as portions of South America's Pacific coast, including Peru and Ecuador, which historically bear the brunt of flooding during strong events. Meanwhile, the forecast shows heightened drought probability across Australia, Indonesia, the Philippines, southern Africa, and parts of Central America and the Caribbean. Northern South America, including key agricultural zones in Brazil and Colombia, also appears in the elevated-drought risk corridor on current models.
For agricultural commodity markets, the geographic overlap is significant. Indonesia and Malaysia together account for roughly 85–90 percent of global palm oil production, and Australia is a top-five global wheat exporter. Simultaneous stress on both of those supply sources during a single El Niño cycle is one of the scenarios that has historically preceded commodity price spikes with a lag of roughly six to eighteen months after the drought onset. The 2015–16 El Niño event, which was also classified in the super category with peak anomalies around +2.3°C, contributed to a global food price index increase of approximately 8 percent in affected commodity categories within a year of peak intensity.
What general news coverage of El Niño forecasts tends to underweight is the role of municipal and regional water infrastructure stress in translating drought maps into tangible supply disruptions for households in the continental United States. During the 1997–98 event, despite the southern U.S. receiving above-normal precipitation overall, specific inland reservoir systems in the Southwest experienced pressure from increased evaporation rates and watershed timing mismatches — meaning that even "wet" El Niño regions don't uniformly translate to replenished water storage. Conversely, the flooding risk in Gulf Coast areas carries implications for distribution infrastructure, including rail and highway corridors that move significant volumes of shelf-stable goods from port facilities. The water storage category on Middle Class Prepper covers some of the residential-scale options relevant to either scenario — reduced municipal reliability in drought zones or contamination risk from flooding events — but the infrastructure-level vulnerabilities are largely outside individual household control and depend heavily on how utilities manage the event in real time.
NOAA and international climate modeling centers are expected to issue updated seasonal outlooks through the fall of 2026 as the event develops, with peak intensity typically occurring in the Northern Hemisphere winter months of December through February.